Adding tooltips and legends
Installed TileMill on your computer.
Reviewed the Crash Course introduction.
Imported data to a TileMill project.
Styled your point data.
Tooltips and legends allow you to add interactivity, additional information, and context to your maps. Below we’ll walk through how to add each to your map.
Tooltips
Tooltips allow you to make maps interactive with dynamic content that appears when a user hovers over or clicks on a map. They can contain HTML and are useful for revealing additional data, images, and other content.
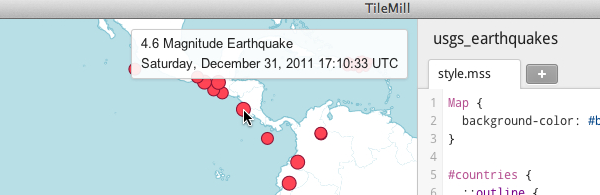
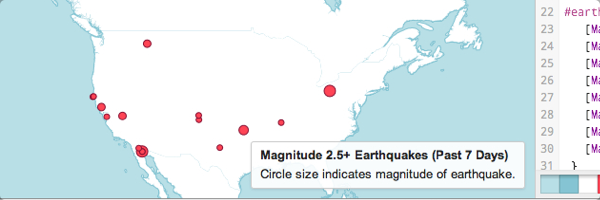
Previously in the Importing data section of this guide, we created a map of earthquakes. Here we will add tooltips that reveal the magnitude, date, and time of each earthquake when users hovers over its point.
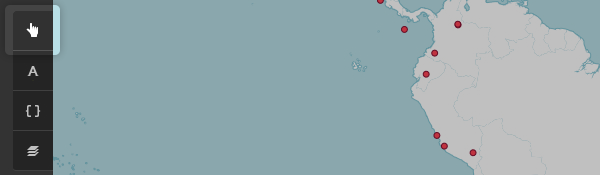
- Open the Templates panel by clicking on the pointer button on the bottom left.
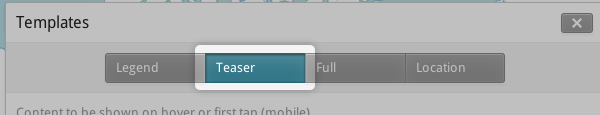
- Click on the “Teaser” tab. Teaser content appears when you hover over a feature and Full content appears when you click on a feature. You can use the Location field to define a URL to be loaded when a feature is clicked.
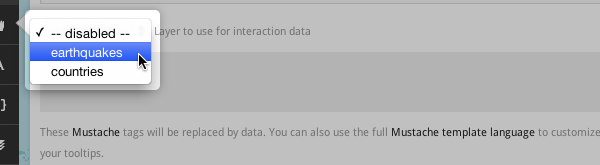
- Select the “Earthquakes” layer to use it for interaction. TileMill only supports one interactive layer at a time.
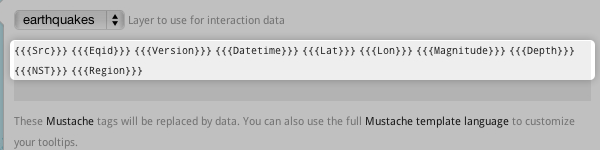
- The data fields for the layer are displayed wrapped in curly Mustache tags. These tags will be replaced by data when you interact with the map. Locate the fields you want to use.
-
Write your template using the Mustache tags. Paste the following code into the Teaser field and use the preview to make sure it looks good:
{{{Magnitude}}} Magnitude Earthquake<br/>{{{DateTime}}} 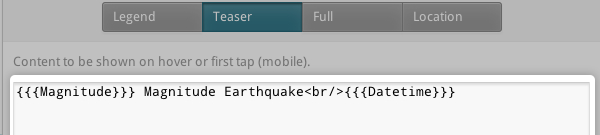 - Click “Save” to save your settings and refresh the map. Close the panel by clicking the close button (X) or by pressing the ESC key. Move your mouse over some points to see the tooltips.
Legends
A legend is permanently on a map and is useful for displaying titles, descriptions, and keys for what is being mapped. It can be styled using HTML, or it can simply contain an image.
Let’s add a legend that describes the theme of the map.
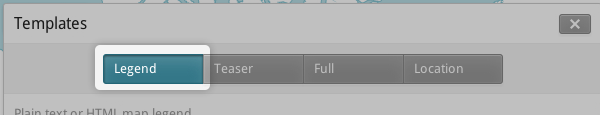
- Open the Templates panel by clicking on the pointer button in the bottom left.
- The Legend tab is open by default.
-
Enter your legend text/html in the Legend field:
<strong>Magnitude 2.5+ Earthquakes (Past 7 Days)</strong><br/>Circle size indicates magnitude of earthquake. 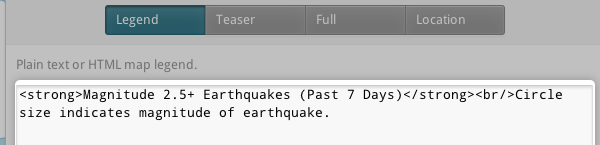 - Click “Save” and close the panel. You will now see your legend in the bottom right corner of the map.
Allowed HTML
For security, unsafe HTML in tooltips and legends are sanitized and JavaScript code is removed. If you want to build sophisticated map interaction with JavaScript on your own website, you can write custom code using the MapBox.js API.
Exporting your map.