Interface tour
When TileMill first starts it will display the project browser, where you will see a few example projects to give you an idea of what TileMill can do. If it is your first time running TileMill you might notice some of the map previews take a couple minutes to appear. This is because a number of external data files need to be downloaded (and will be saved so they should not to be downloaded again, unless you remove them from the cache).
If you click on one of the projects you will be taken to the editing interface:
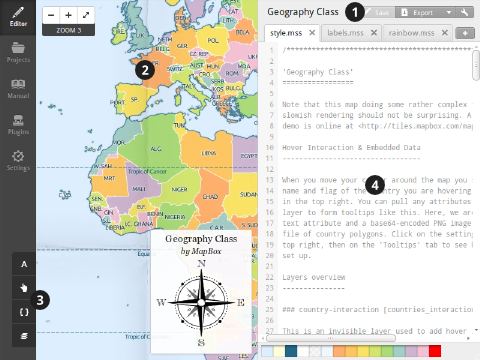
- Main toolbar
- Map preview
- Editing tools
- Stylesheet editor
Map preview
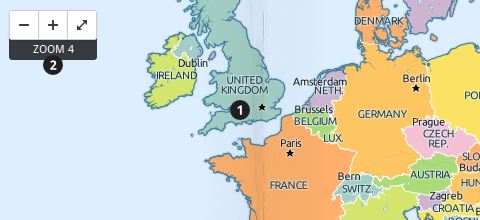
- Map preview
- Zoom controls & full-page toggle
TileMill provides an interactive preview of the map as you are designing it. The map updates every time you save the project.
You can pan around by clicking and dragging, and zoom in and out clicking on the + and - buttons. Zooming can also be controlled with your mouse wheel when the cursor is over the map, or by holding down the Shift key and drawing a box on the map of the area you wish to zoom to. The zoom level indicator displays the current zoom level, which is useful to know when designing and checking styles.
The full-page toggle button expands the size of the preview, and collapses it back once you are in the big-preview mode.
When you save a project TileMill also saves the position and scale you were viewing the map at, so if you are only mapping a small area such as a city you won’t have to zoom in there every time you reopen the project.
Layers list
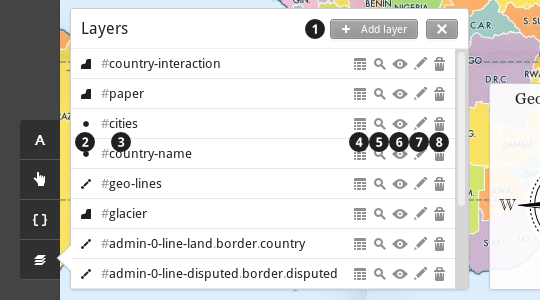
- Add layer button
- Geometry icon & drag handle
- IDs and classes
- Inspect layer data
- Zoom map view to layer extent
- Toggle layer visibility
- Edit layer settings
- Delete layer
Clicking the add layer button (1) opens a dialog where you can choose a shapefile, KML file, GeoJSON file, or GeoTIFF to add to the project. Each layer must have one ID (indicated by the # prefix), and may optionally have one or more classes (indicated by a . prefix). These are defined when the layer is added but can be changed any time by clicking the ‘Edit layer’ icon.
A layer can be easily reordered by clicking on the draggable geometry icon (2) and moving it above or below another layer. Overlapping areas of layers will be rendered such that the highest layer on the list will cover layers beneath it.
For the purposes of styling, a layer can be one of four types of geometries - point, line, polygon, or raster. This is indicated by the geometry icon. Certain types of styles are only applicable to certain types of layers, so it’s good to know what each one is.
Clicking the magnifying glass icon (5) will adjust the map preview so that the entire contents of that layer are within the view. (Depending on your styling rules you may not actually be able to see the data.)
To hide a layer without deleting it, click the eye icon (6) and save your project. A layer can be completely removed by clicking the trash can icon (7) and saving the project.
Layer data inspector
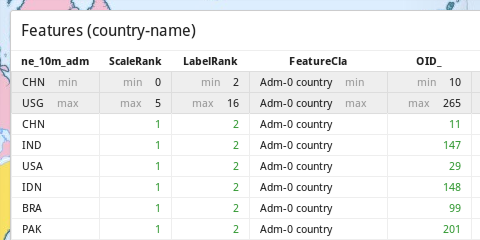
If you click on the data table icon of any layer, a drawer will slide in from the left and a table of data will appear. (It may take a few seconds for the data to show up if you are inspecting a complex file.)
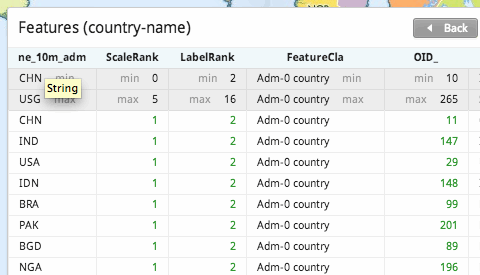
Hover your cursor for a moment over a field name in the table to reveal the datatype of the column. In this case hovering over ne_10m_adm shows a String type field.
Code editor
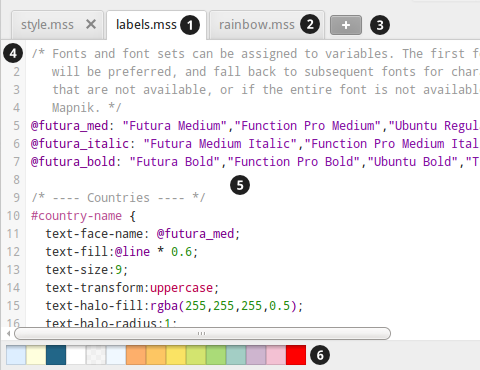
- Active stylesheet tab
- Inactive stylesheet tabs
- New stylesheet button
- Line numbers
- Text area
- Color palette
TileMill provides an integrated code editor for editing the map stylesheets. This editor will make sure you write valid code, coloring correctly formatted text as you write it (syntax highlighting) and highlighting any errors if you try to save an invalid file.
The TileMill editor supports autocomplete: when typing a property name like polygon-fill, you can type polygon- and immediately hit the tab key in order to get a list of available completions. This also works with values, like line-join: miter: typing mi and pressing tab will autocomplete miter. If you have variables like @acolor defined in your stylesheet, you can autocomplete them by typing @ and tab. After the autocomplete menu is open, it can be navigated with the mouse, arrow keys, or with further presses of tab and shift-tab to go backwards. Press enter to accept an autocomplete suggestion.
Stylesheets
As your map style becomes more complex, you may wish to keep things organized by splitting the style across multiple files. New stylesheets can be added with the + button on the tab bar and entering a name for the file. Though not required, there is a convention of using the file extention .mss for ‘map stylesheet’.
Stylesheets can be re-ordered by clicking and dragging their tabs within the tab bar. Note that just like CSS, the order can have an effect on the way a map is rendered - if two styles conflict, the one that is defined last will be applied. Here, ‘last’ means closest to the bottom of the file in the tab furthest to the right.
Color palette
TileMill keeps track of all the colors you use in a project and makes it easy to edit them with a color picker.
Editing tools
Interaction editor
Clicking on the ‘Interaction’ icon will display a panel for adding a legend and interactive tooltips to your map.
Font reference
Clicking on the ‘Font’ icon will display a list of all the system fonts Mapnik can find. Clicking on a font will highlight its name making it easy to copy & paste it into your stylesheet.
Unlike what you may be used to from CSS or common word processor interfaces, there are no distinct properties for a font’s family (eg ‘Arial’), weight (eg bold), and style (eg italic). This is why, for example, “Arial Regular”, “Arial Bold”, and “Arial Italic” are listed individually.
Carto reference
Clicking on the ‘Carto’ icon will display an abbreviated reference of the different properties you can use in your stylesheet.