Advanced map design
Added an earthquake CSV layer from the Crash Course.
Used conditional styles to control the appearance of points based on data.
This guide will cover some of the more advanced techniques you can employ in TileMill to take your map to the next level. For demonstration, we will continue to work with the 2010 tornado data from the preparing data with Google Docs guide.
Styling for Zoom Levels
Interactive maps give users the ability to change the scale by zooming in or out and we must design them accordingly. Assuming you have imported your point data and done some initial styling, it is time to start thinking about how your map will look at different zoom levels.
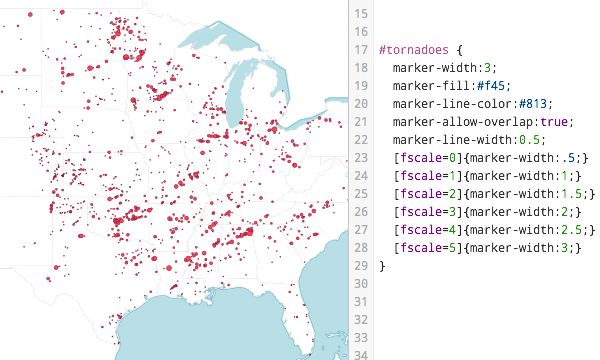
Here is the tornado map at zoom level 4 after sizing the markers based on their intensity (f-scale).
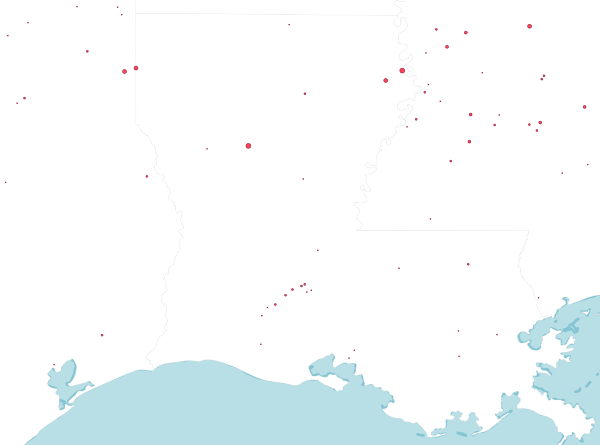
 And here is the same map at zoom level 7. Notice that the dots did not scale with the rest of the maps and could be considered too small.
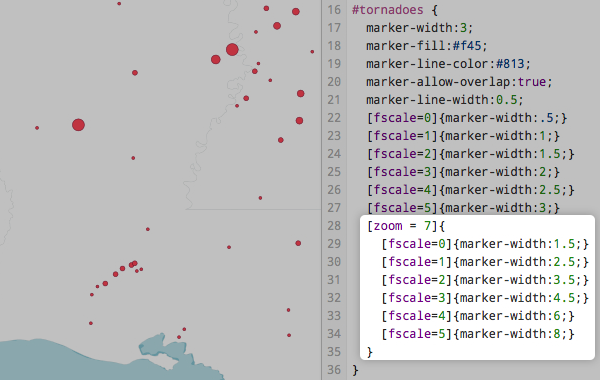
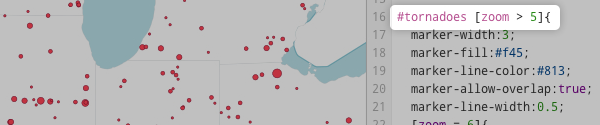
 With some simple CartoCSS, you can solve this by conditioning your styles based on the zoom level.
The highlighted CartoCSS below is saying to TileMill, “when the zoom level is 7, apply the following style.” You can do this for as many levels as you wish, and include any kind of styling. This is useful for scaling back the number of dots, icons, and labels as you zoom out, and creating a greater level of detail as you zoom in.
 The following symbols are allowed in conditional statements:
 =, !=, >, >=, <, <=
You can also group by zoom ranges by setting a beginning and an end, like this:
[zoom >= 4][zoom <=8] {
  …styling…
}
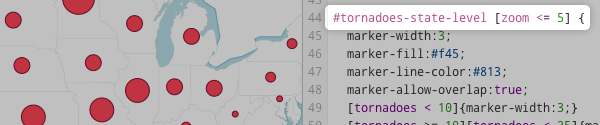
Zoom level conditioning can also be used to limit the visibility of specific layers to certain zoom ranges, making it possible to “turn them on” or “turn them off” as you zoom in or out. This method is particularly useful for joining multiple geographic levels of data.
Take the tornado map for example. At the national level it is quite cluttered and hard to decipher individual points where there are clusters. At this zoom level, one option might be to display a scaled dot for each state that represents total number of tornadoes that occurred in that state. Then, as the user zooms in, the state-level layer goes away and the individual tornado points appear.
With this particular data we were able to aggregate to the state level using a pivot table and then geocoded the state points. Add this newly created data to the project as a new layer. Then simply add zoom level conditions after the layer names in your CartoCSS code, and continue to style normally.
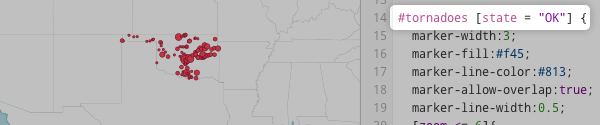
You can also use this same syntax to single-out features on the map where a field in your data meets a certain criteria. For example, the code below will only show points on the #tornado layer for Oklahoma. “state” is the name of a field in the tornado data that contains state abbreviations.
#tornadoes [state = "OK"] {
  …styling…
}
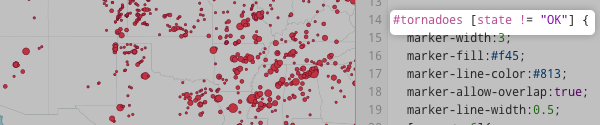
The reverse is also possible. Show states that are not Oklahoma:
#tornadoes [state != "OK"] {
  …styling…
}
Text Labels
In order to deliver information on a map more immediately, sometimes it is useful to label your data with the actual number or feature that is being represented. This can be combined with the dot or just be a label on its own.
For our tornado map, we have decided to display the total number of tornadoes inside the state-level dots. To do this we need to add just a few lines to the layer’s CartoCSS:
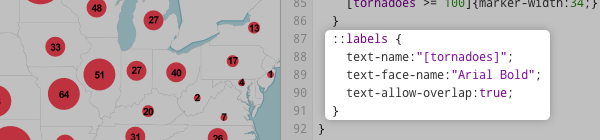
::label
This creates a new symbolizer for your layer. The name ‘label’ here is arbitrary, you can call it whatever you like. The position of the symbolizer in CartoCSS determines the order of its rendering. The first code in a CartoCSS layer is rendered first on the map and will be below anything that is rendered after it. Therefore, if you need a layer feature to be on top, like we do with the labels, it must come last in the code.text-name
This denotes the field whose text will be displayed.text-face-name
This sets the font for the text label. You can view a list of available system fonts by clicking the font button (A) on the lower left.text-allow-overlap
This allows the text and the dots to be displayed together at the same location. By default this option is set to false, which prevents overlapping items.
That is all you need to get started with labels. The same idea applies to placename labels as well. You can further style them with the text- style parameters, changing things like size, color, opacity, placement, and more.
Images as Icons
TileMill supports using SVG (Scalable Vector Graphic) images as markers on your map. It is possible that we could use a custom-made tornado icon in place of the circle markers. The first thing you need is the SVG file saved somewhere on your system, preferably in your project folder for the sake of organization (Documents/MapBox/project/project-name/). Then it’s all in the CartoCSS.
![]()
point-file
This designates the path to the SVG relative to your project folder. In this case the SVG is located in Documents/MapBox/project/2010-tornadoes/icons/.point-allow-overlap
Like other-allow-overlapparameters, this allows the images to be displayed even if they will be on top of each other.point-transform
This is the parameter used to scale and move the image, among other things. A value of"scale(1)"will display the image at its original size, while"scale(0.5)"and"scale(2)"will display it at 50% and 200% respectively. You can also use this property to move the image vertically and horizontally by using the property"translate()". For example, the value"translate(20, -40)"will move the image 20 pixels to the right and 40 pixels up. There are several other properties that you can employ withpoint-transform. Learn about them on W3.
Exporting for Compositing
When your map contains multiple levels of data as our tornado map does, it is sometimes wise to export each level separately. This has multiple benefits. Firstly, it compartmentalizes your map so that when updating you may not have to re-export the entire map. Secondly, it gives you greater flexibility when compositing.
Thirdly, interactivity can only be active on one layer at a time. This means if we want a hover tooltip for the state-level dots and for the individual dots, we cannot export them together.
When exporting individual pieces of your project, a very helpful tool is the ability to comment-out specific CartoCSS code. Anything commented-out will remain in your code, but not render on the map. All this entails is placing /* before and */ after the code you want to comment-out. This is also a way to write comments into the code, hence the name.
We have plans to composite this tornado map with an existing world baselayer available from Mapbox, so the first thing to do will be to comment-out the default blue and white world base and the state borders.
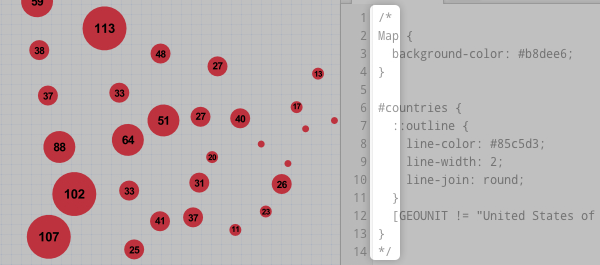 Notice that the code between the
 /* and */ is now greyed-out, and the background of the map is transparent.
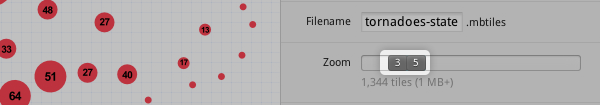
Now we can create a tooltip for the state-level dots, and export. On the export page, be sure to select only the zoom levels for this particular piece of the map.
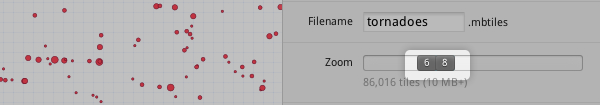
 Next we create and switch the tooltip to the individual dots layer, and export. Change the zoom levels and filename accordingly.
 We now have two MBTiles with their own interactivity that we can composite together with a slick base map.
Here is the final map:
And the final project CartoCSS code for reference:
Map {
  background-color: #b8dee6;
}

#countries {
  ::outline {
    line-color: #85c5d3;
    line-width: 2;
    line-join: round;
  }
  [GEOUNIT != "United States of America"]{polygon-fill: #fff;}
}

/*Individual tornado points*/
#tornadoes [zoom > 5]{
  marker-width:6;
  marker-fill:#f45;
  marker-line-color:#813;
  marker-allow-overlap:true;
  marker-line-width:0.5;
  [zoom = 6]{
    [fscale=0]{marker-width:2.5;}
    [fscale=1]{marker-width:4;}
    [fscale=2]{marker-width:5.5;}
    [fscale=3]{marker-width:7;}
    [fscale=4]{marker-width:9;}
    [fscale=5]{marker-width:12;}
  }
  [zoom = 7]{
    [fscale=0]{marker-width:4;}
    [fscale=1]{marker-width:6;}
    [fscale=2]{marker-width:8;}
    [fscale=3]{marker-width:11;}
    [fscale=4]{marker-width:14;}
    [fscale=5]{marker-width:18;}
  }
  [zoom = 8]{
    [fscale=0]{marker-width:6;}
    [fscale=1]{marker-width:9;}
    [fscale=2]{marker-width:12;}
    [fscale=3]{marker-width:16;}
    [fscale=4]{marker-width:22;}
    [fscale=5]{marker-width:30;}
  }
}

/*State-level dots and labels*/
#tornadoes-state-level [zoom <= 5] {
  marker-width:6;
  marker-fill:#f45;
  marker-line-color:#813;
  marker-line-opacity:0;
  marker-allow-overlap:true;
  [zoom = 3]{
    [tornadoes < 10]{marker-width:6;}
    [tornadoes >= 10][tornadoes < 25]{marker-width:10;}
    [tornadoes >= 25][tornadoes < 50]{marker-width:16;}
    [tornadoes >= 50][tornadoes < 100]{marker-width:24;}
    [tornadoes >= 100]{marker-width:16;}
  }
  [zoom = 4]{
    [tornadoes < 10]{marker-width:7;}
    [tornadoes >= 10][tornadoes < 25]{marker-width:12;}
    [tornadoes >= 25][tornadoes < 50]{marker-width:20;}
    [tornadoes >= 50][tornadoes < 100]{marker-width:32;}
    [tornadoes >= 100]{marker-width:44;}
  }
  [zoom = 5]{
    [tornadoes < 10]{marker-width:10;}
    [tornadoes >= 10][tornadoes < 25]{marker-width:18;}
    [tornadoes >= 25][tornadoes < 50]{marker-width:28;}
    [tornadoes >= 50][tornadoes < 100]{marker-width:44;}
    [tornadoes >= 100]{marker-width:68;}
  }
  ::labels {
    text-name:"[tornadoes]";
    text-face-name:"Arial Bold";
    text-allow-overlap:true;
    [zoom = 3]{
      [tornadoes < 25]{text-opacity:0;}
    }
    [zoom = 4]{
      [tornadoes < 10]{text-opacity:0;}
      [tornadoes >= 10][tornadoes < 25]{text-size:8;}
      [tornadoes >= 25][tornadoes < 50]{text-size:10;}
      [tornadoes >= 50][tornadoes < 100]{text-size:11.5;}
      [tornadoes >= 100]{text-size:13;}
    }
    [zoom = 5]{
      [tornadoes < 10]{text-size:8;}
      [tornadoes >= 10][tornadoes < 25]{text-size:10;}
      [tornadoes >= 25][tornadoes < 50]{text-size:11.5;}
      [tornadoes >= 50][tornadoes < 100]{text-size:13;}
      [tornadoes >= 100]{text-size:16;}
    }
  }
}

/* State borders */
#states {
  line-color:#ccc;
  line-width:0.5;
  polygon-opacity:1;
  polygon-fill:#fff;
}
Using MapBox to upload and composite your map.