Google charts in tooltips
This is a short step-by-step article for building charts and graphs to enhance interactivity in TileMill. In our accompanying article, we’ve written about adding identifying information for point data. Here we will walk through using Google’s Chart API.
Google’s Chart API is a unique tool that allows you to embed dynamic charts and graphs in the interactive space of TileMill. Little to no programming experience is needed to adjust an existing chart in their gallery or build one from scratch in their interactive chart playground.
How it works
Here’s how it works, it’s simple: the API generates an image based on the data that is sent via an URL request. Within the URL, parameters are set and data variables are defined and returns a PNG image of a chart based on the data. A basic chart consists of only a few components: base URL, chart type, chart size, data values, and data labels. The only steps you need to take are:
- Set parameters and define data values
- Copy and paste URL into the interactivity window in TileMill
Set parameters and define data
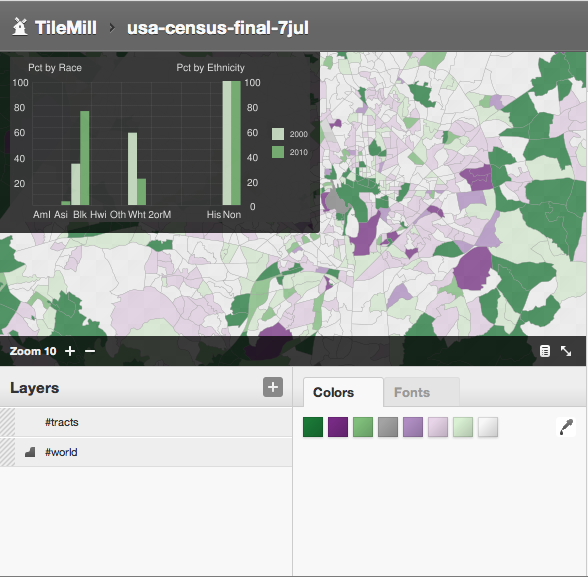
Whether you are using a shapefile, geojson file, or a PostGIS database, data variables are defined as tokens, {{{ID}}}, within TileMill and can be inserted into the data values component within the Chart API URL. Let’s follow this example of a chart for a map we’ve been working on recently:
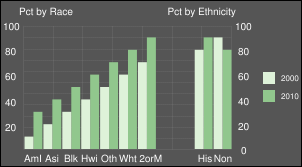
Here is the code for this example. Feel free to copy and paste the following code into the chart playground to try it out for yourself.
chf=a,s,000000DC|bg,s,3A3A3A
chxl=1:AmI|Asi|Blk|Hwi|Oth|Wht|+++2orM|++++++++++++|+++++|+His|+Non
chbh=a,0,1
chxr=0,1
chxs=0,FFFFFF,10,0,l,FFFFFF|1,FFFFFF,10,0,l,FFFFFF|2,FFFFFF,10,0,l,FFFFFF
chxt=y,x,r
chs=300x165
cht=bvg
chco=D9F0D3,7FBF7B
chds=0,1,0,1
chd=t:.1,.2,.3,.4,.5,.6,.7,_,_,.8,.9|.3,.4,.5,.6,.7,.8,.9,_,_,.9,.8
chdl=2000|2010
chdls=FFFFFF,8
chg=14.3,9,1,1
chls=1|1
chma=0,0,0,10
chm=b,D9F0D3,0,0,0|b,7FBF7B,0,0,0
chtt=++Pct+by+Race++++++++++++++++++++++++++++++++++Pct+by+Ethnicity
chts=FFFFFF,10.5
There are three key parameters for defining and displaying your data in TileMill:
chd: , chl: , chds:
chd: defines the data values. In the example above, the data is hard coded into the the URL as simple text format, chd=t. The Google Charts API accepts data in a number of formats and allows you to easily specify the data variables that contain the values coming from TileMill. Using the simple text format, data variables within TileMill can replace the hard-coded numbers in the above example. This way the chart image will dynamically change based on the data as you mouse-over or click each interactive point of your map. Here’s how this parameter might look using TileMill variable tokens:
chd=t: {{{data1}}},{{{data2}}},{{{data3}}},{{{data4}}},{{{data5}}},{{{data6}}},{{{data7}}},_,_,{{{data8}}},{{{data9}}}|
{{{data10}}},{{{data11}}},{{{data12}}},{{{data13}}},{{{data14}}},{{{data15}}},{{{data16}}},_,_,{{{data17}}},{{{data18}}}
Google provides a great overview of the key components here.
Copy and paste into TileMill
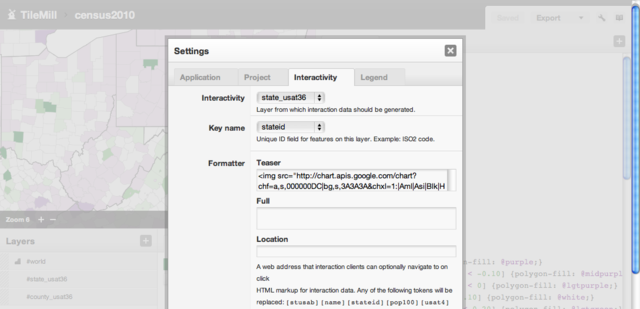
After you’ve set your parameters, defined your data, and defined your labels, you can wrap an HTML image tag around your Image API URL then copy and paste your new code into the interactivity window within TileMill.
- Click ‘settings > interactivity and then pick the layer from which you want to choose your data
- Set
Key nameto a unique value in your dataset.
Once you’ve set those fields, you will see two additional fields below. The Teaser field displays content in an overlay on mouse-over, and Full displays content on click. You should also see your data tokens at the bottom of the window.
We’ll set up the Teaser field in this example to provide an example for fast and dynamic interactivity using charts with a mouse-over. From the above example in the chart playground, you should see a URL that contains all the parameters you just set.
The new HTML image tag with the URL should look something like this:
<img src="http://chart.apis.google.com/chart
  ?chf=a,s,000000DC|bg,s,3A3A3A
  &chxl=1:AmI|Asi|Blk|Hwi|Oth|Wht|+++2orM|++++++++++++|+++++|+His|+Non
  &chbh=a,0,1
  &chxr=0,1
  &chxs=0,FFFFFF,10,0,l,FFFFFF|1,FFFFFF,10,0,l,FFFFFF|2,FFFFFF,10,0,l,FFFFFF
  &chxt=y,x,r
  &chs=300x165
  &cht=bvg
  &chco=D9F0D3,7FBF7B
  &chds=0,1,0,1
  &chd=t: {{{data1}}},{{{data2}}},{{{data3}}},{{{data4}}},{{{data5}}},{{{data6}}},{{{data7}}},_,_,{{{data8}}},{{{data9}}}|{{{data10}}},{{{data11}}},{{{data12}}},{{{data13}}},{{{data14}}},{{{data15}}},{{{data16}}},_,_,{{{data17}}},{{{data18}}}
  &chdl=2000|2010
  &chdls=FFFFFF,8
  &chg=14.3,9,1,1
  &chls=1|1&chma=0,0,0,10
  &chm=b,D9F0D3,0,0,0|b,7FBF7B,0,0,0
  &chtt=++Pct+by+Race++++++++++++++++++++++++++++++++++Pct+by+Ethnicity&chts=FFFFFF,10.5" width="300" height="165" alt="Pct Race/Ethnicity" />
Then copy your new image tag into the Teaser field.
Final Product
Once you click Save, TileMill will process the settings and mouse-over interactivity will be available for your map. You should now see an interactive pop-up in your preview window.