Preparing data with Google Docs
Tip: want to import a spreadsheet directly to Mapbox? See the documentation for import CSV & other types of files directly into the editor.
You probably already have a favorite software or database system for data manipulation. No problem, as long as it gets your data where it needs to be. We do highly recommend using Google Docs in conjunction, for it does certain tasks very well. It’s also free, has versioning, and allows you to use our nifty Geocoding and GeoJSON Export scripts. Importing your data into a Google Spreadsheet is relatively painless. These tutorials will guide you through a few of the more advanced tools offered in Google Spreadsheets for pre-TileMill data preparation.
For demonstration purposes we will be using 2010 tornado data, originally found at the NOAA’s Storm Prediction Center.
Pivot Tables
A pivot table is a summarization tool for your data. It creates a new table that allows you to sort, count, total, or average the selected data. When preparing data for mapping, pivot tables are often used to aggregate a list of data to a specific geographical level, such as countries or states.
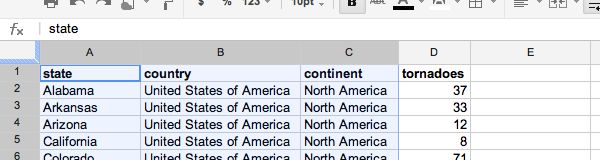
Take, for example, this tornado data. The raw data is a list of all the tornados that occurred in 2010 and their coordinates and other statistics. Mapping these points is relatively easy and results in an informative and straightforward map. But say we want to do some analysis on this data and map the total number of occurrences per state? Using the pivot table tool, we can quickly create a new table based on this calculation.
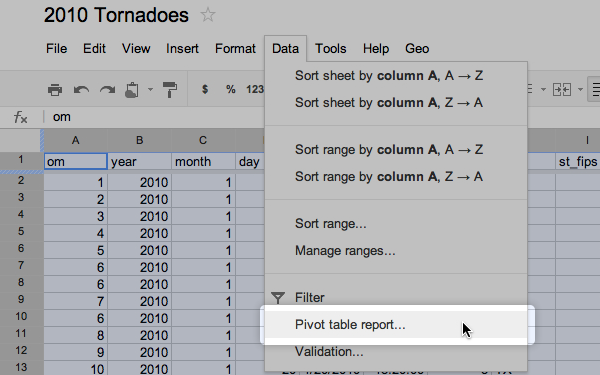
- Select the data you wish to summarize. In this case the entire table.
- In the Data menu, click Pivot table report.
- A new sheet called “Pivot Table 1” will be created and the Report Editor will appear on the right.
- Click Add field next to Rows and choose the field to be aggregated on. In this case “state”.

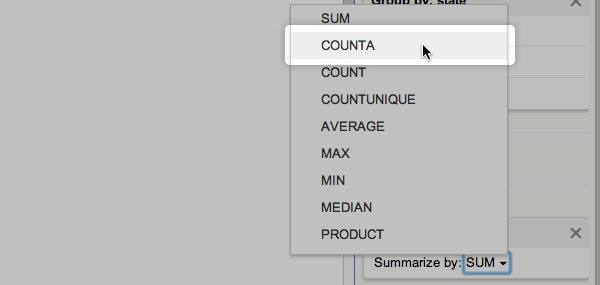
- Click Add field next to Values and choose the field to be calculated. In this case we simply want to count the number of times each state appears in a row.

- Change Summarize by to COUNTA. COUNTA will count the number of cells that contain the text specified in the Rows field.
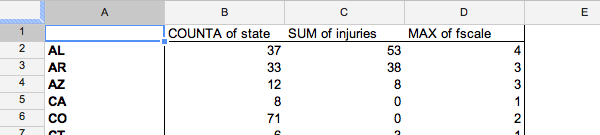
 You now have a new table that shows the number of tornadoes per state in 2010. We can calculate a variety of things at the state level in addition to this.
 - Click Add field next to Values and choose “injuries”.
- We want Summarize by: SUM, which is the default calculation. Added to the table is the total number of tornado-related injuries by state.
- Click Add field next to Values and choose “fscale”.
- Choose Summarize by: MAX. Added to the table is the highest F-Scale tornado that occurred in each state.
- Once your pivot table is complete, copy and paste the cells into a new sheet. This creates a permanent copy of the table for you to create column headers and further manipulate, and keeps the pivot table available to use.
These steps serve only a basic example of how to use this tool. There are many more things you can accomplish with pivot tables and you may need to make adjustments based on your own data.
Geocoding
In order to import your CSV or GeoJSON into TileMill, it must have columns that specify latitude and longitude coordinates. Quite often your data will have location names, but not coordinates. So how do you get the coordinate of a point based on the name of a location? This exact process is called geocoding, and there is a script you can add to your google spreadsheet that will automate this process for you.
This tutorial will guide you through geocoding using this script. For further information regarding geocoding services see this article.
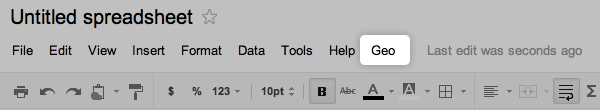
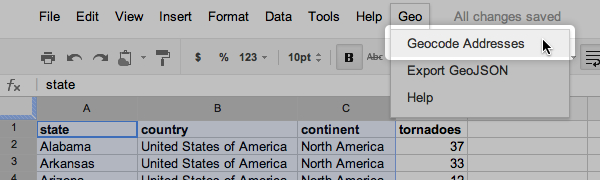
- Go to https://github.com/mapbox/geo-googledocs and follow the installation instructions. When you are done you should have a new menu called Geo on the toolbar.
- Select the columns you wish to geocode. Be as specific as possible with place names, including country and even continent. Some names can refer to multiple places. Georgia is a country as well as a U.S. state and New York could mean the state, the county, or the city. Also use full names rather than abbreviations when possible.
- Click the Geo menu. Then click Geocode Addresses. If this is your first time trying to load the script you will be prompted by google to authorize it.
- You can choose either MapQuest’s or Yahoo’s geocoding service. Note that MapQuest does not require an API key, while Yahoo does. You can get one at http://developer.yahoo.com/geo/placefinder/.
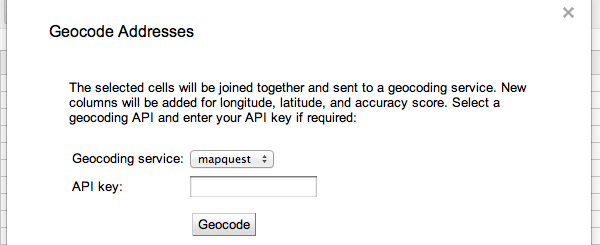
- Click Geocode.
- Wait for the process to complete then close the popup window.
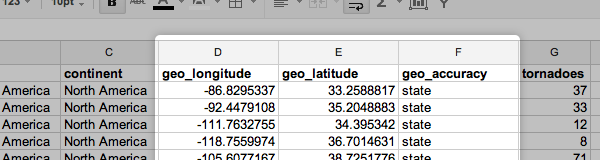
- You will notice three new columns have been created and filled in: geo_longitude, geo_latitude, and geo_accuracy. Geo_accuracy is included for purely for assessing the quality and geographic level of the returned coordinates.
Geocoding is not always 100% accurate. There are times when the service will return a wrong coordinate or a blank, so it is important to double check these values. You might not catch any errors until viewing the data on a map. In these cases you may have to manually adjust the coordinates.
Publishing a CSV
Once your data is ready, you will want to publish it as a CSV. TileMill can import a CSV file as long as it has the appropriate longitude and latitude columns. Publishing with Google Docs will generate a link that you can use to import your data into TileMill. Of course, you can also simply save your spreadsheet to CSV and load that file into TileMill, but publishing gives you the option to forgo a lot of hassle in the future if your data requires updating.
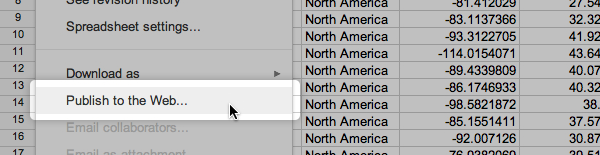
- Go to the File menu and click Publish to the web….
- Under Sheets to publish, select the sheet with your final data.
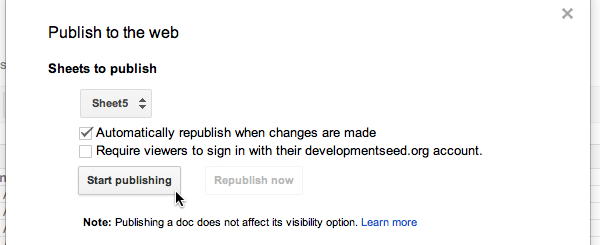
- Check Automatically republish when changes are made. Enabling this will allow your TileMill project to update whenever a change is made to your spreadsheet without having to republish and reimport.
- Uncheck Require viewers to sign in….
- Click Start publishing. If prompted by a warning hit OK.
- Under Get a link to the published data, in the first box select CSV.
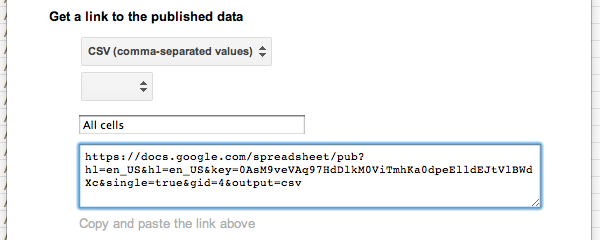
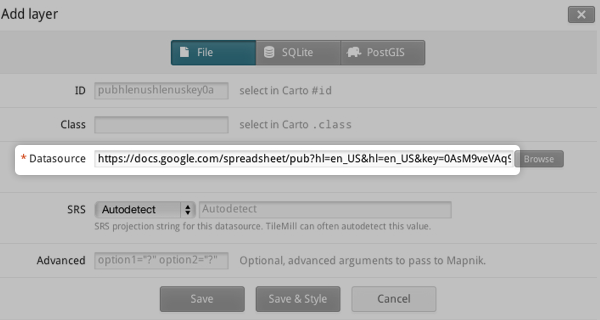
- Copy the link and paste it in the Datasource field when adding the layer in TileMill.
Flushing the Cache
TileMill caches layer data for better performance, but this can sometimes cause updated data from the same source to not be immediately available. To rectify this we can manually tell TileMill to flush the cache.
Say you make an edit to the previously published spreadsheet. To see those changes immediately take effect in TileMill:
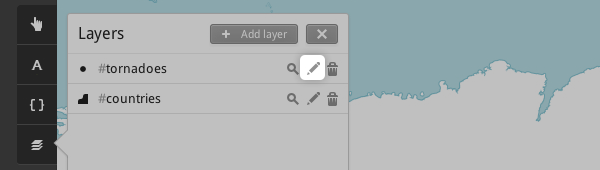
-
Click the edit button on the relative layer.
-
Click Flush cache underneath the datasource field.
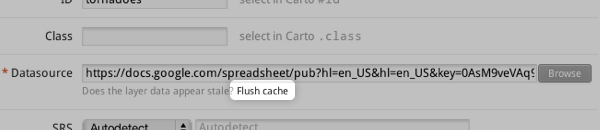
-
Click Save. TileMill will now load the fresh data.
Add a CSV layer to your TileMill project.