Styling data
Installed TileMill on your computer.
Reviewed the Crash Course introduction.
Imported data into a TileMill project.
TileMill uses a language called CartoCSS to determine the look of a map. Colors, sizes, and shapes can all be manipulated by applying their relative CartoCS parameters in the stylesheet panel to the right of the map. Read the CartoCSS manual for a more detailed introduction to the language.
In the previous crash course section on Importing data, we added an earthquake point layer using the “Save & Style” button. This button automatically added several styling parameters to your stylesheet and gave them an initial value.
-
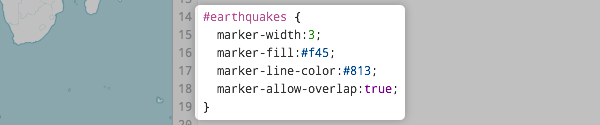
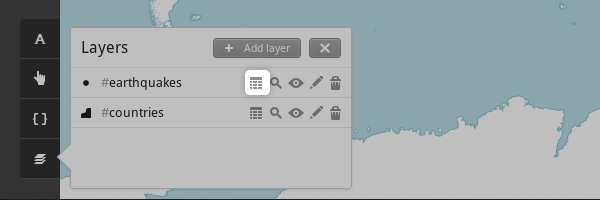
#earthquakes
This is the layer to which the styles are applied. -
marker-width
This determines the size of the markers, in pixels. Ifmarker-heightis not specified, it is given the same value, resulting in a circle marker. You can experiment with changing this by typing in a different number. -
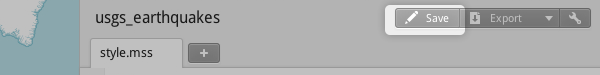
Click the “Save” button to save your project and trigger the map preview to update.
-
marker-fill
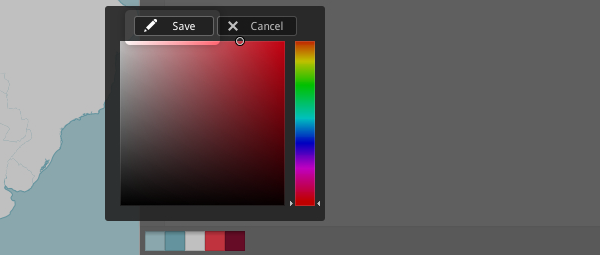
This is the color of the inside of the marker. There are two methods for changing color values. You can either type in a new value, or you can use the color swatches at the bottom of the CartoCSS panel. Try changing the marker color by clicking the light red swatch and selecting a new color.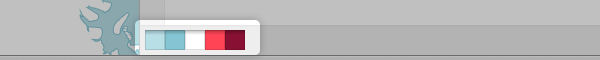
-
Click “Save” in the color picker to see your changes. Notice the corresponding color value is updated in the CartoCSS.
-
marker-line-color
This is the color of the border of the marker. This time try changing the color by replacing the hex value#813with#000, the code for black. -
Click “Save”. Notice that the color swatch is updated with the new color.
-
marker-allow-overlap
This allows markers to be placed on top of each other. If this is not specified or set tofalse, potentially overlapping markers will not be displayed.
Conditional styles
Conditional CartoCSS styles allow you to change the appearance of the points on your map based on attributes in the data. Here we will customize the earthquake points based on the magnitude of the quake.
- Review the available data for the layer in the feature inspector.
- Find the column called
Magnitudeand examine the range of values. This will help you decide how to scale the points.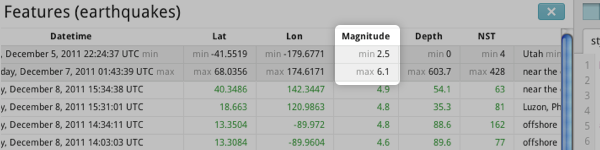
-
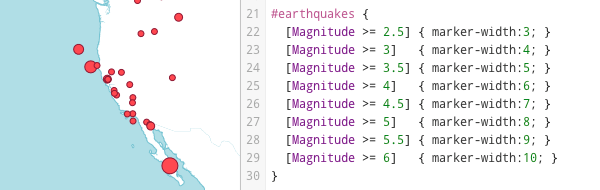
Add the following CartoCSS rule to the bottom of your stylesheet. This CartoCSS rule sets a larger
marker-widthfor features that have a largerMagnitudevalue.#earthquakes { [Magnitude >= 2.5] { marker-width:6; } [Magnitude >= 3] { marker-width:8; } [Magnitude >= 3.5] { marker-width:10; } [Magnitude >= 4] { marker-width:12; } [Magnitude >= 4.5] { marker-width:14; } [Magnitude >= 5] { marker-width:16; } [Magnitude >= 5.5] { marker-width:18; } [Magnitude >= 6] { marker-width:20; } } - Click “Save” to view your changes.
- Use the map preview to confirm that the style is working. Adjust the CartoCSS rule until you are satisfied.
These are just a few of the basic parameters for styling point data. For a comprehensive look at styling possibilities, checkout the CartoCSS reference section in TileMill and online.
Adding tooltips and a legend to your map.